Designing and building a testable trading terminal prototype with Claude Code
A CFD broker had neither a terminal nor a design. I created the interface and built a functional web prototype for usability testing—without a separate engineering cycle.
Outcome
I deployed the prototype to GitHub Pages and shared it with the research team through a public link.
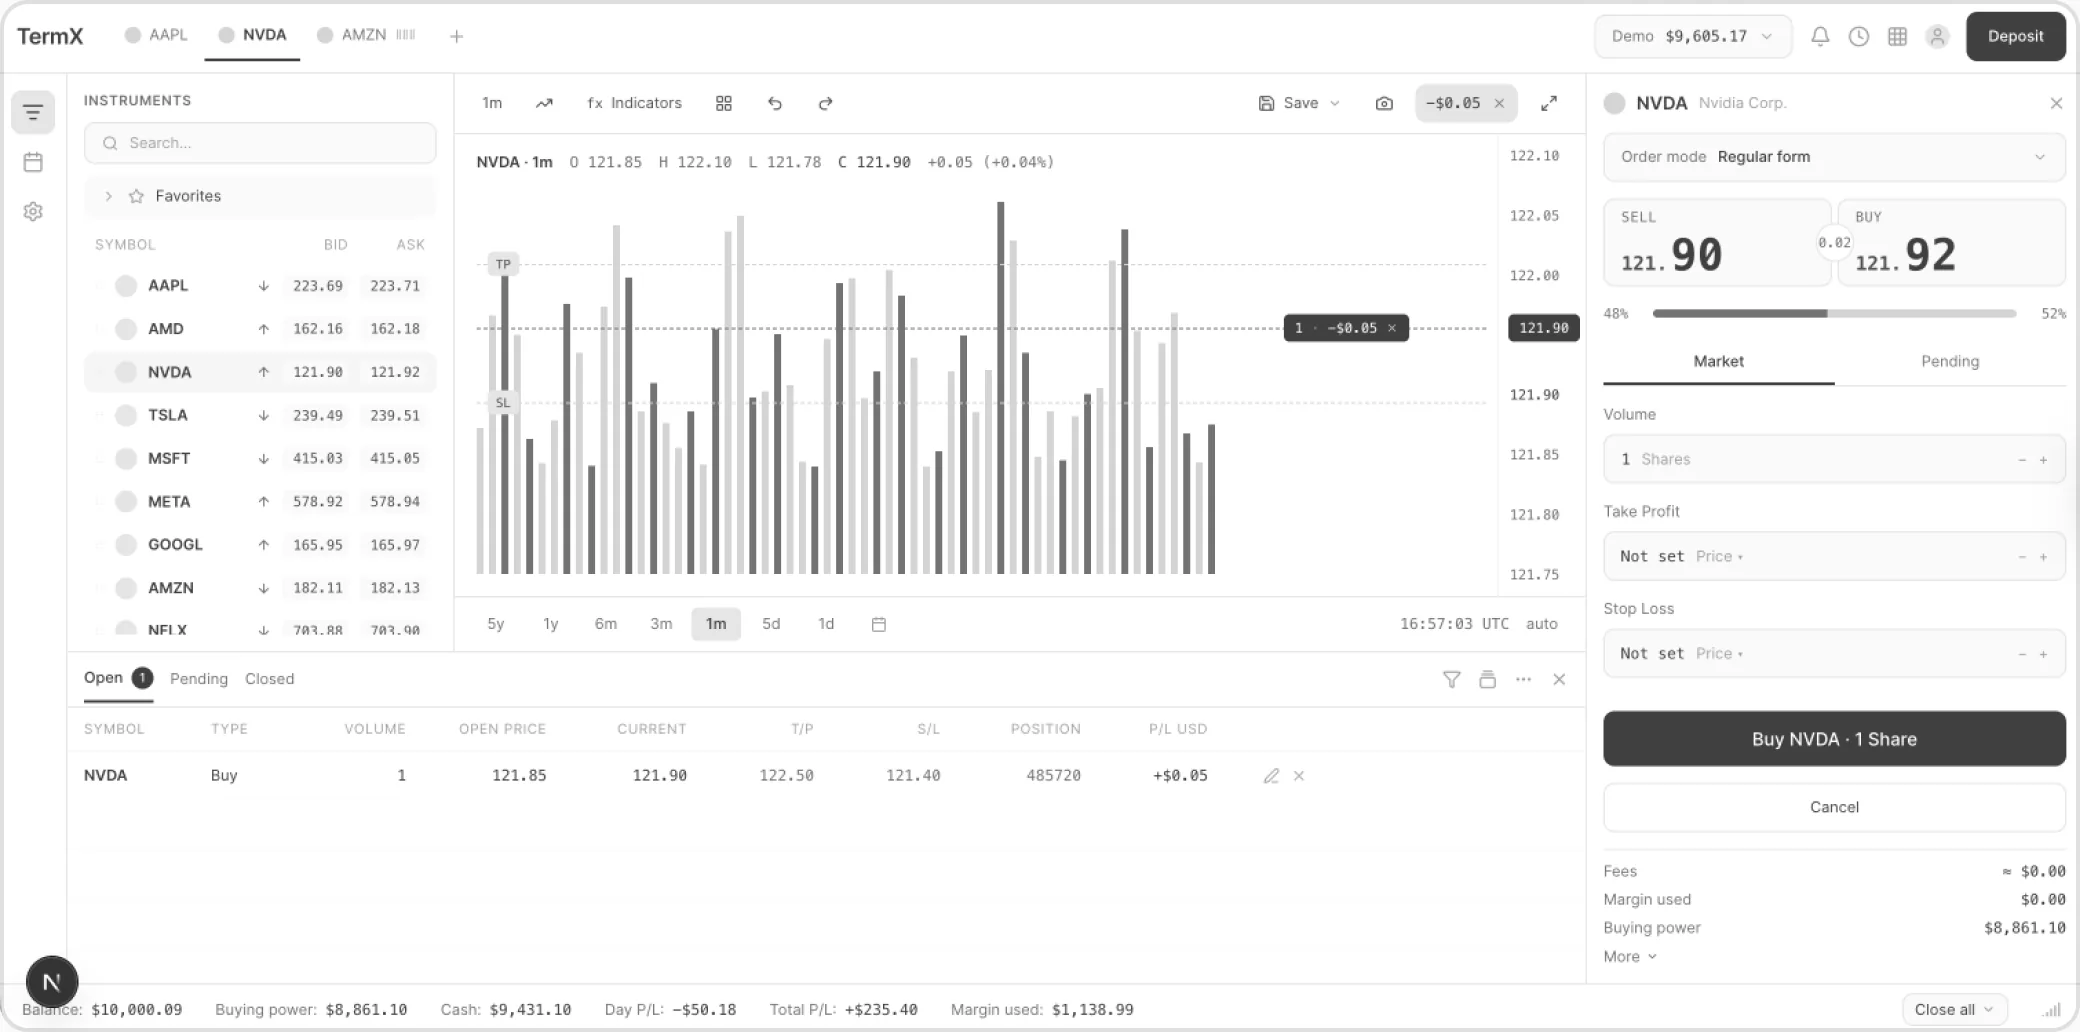
Instead of navigating through a predefined sequence of screens, participants could search for instruments, inspect changing market data, place trades, manage positions, and see the consequences of their decisions across the interface.
Live trading terminal prototype
Open full prototype ↗Video walkthrough — the interactive prototype is available on desktop
The challenge
The research team was conducting a broader study for a CFD broker. One part of it required usability testing of a desktop trading terminal.
There was one fundamental problem: the client had neither an existing terminal nor a design for one.
A static Figma prototype could reproduce the appearance of individual screens, but the most important research questions lived between those screens:
- Does the user understand the relationship between an instrument, its chart, and the order ticket?
- Can they open a trade from the context where the opportunity appears?
- Do they notice how a position affects their balance and profit or loss?
- Can they confidently manage and close the position?
The challenge was not simply to draw a terminal. It was to make one feel real enough for research—without building a production trading platform.
Building the design foundation
By the time I joined, the UX researchers had already completed a substantial competitor analysis. From that work, we selected two visual references:
- Robinhood Legends for its data density, trading aesthetic, and use of a strong accent color.
- Revolut for its softer surfaces, rounded controls, spacing, and overall visual refinement.
I analysed their key flows and translated the visual direction into a design.md specification covering:
Core palette and semantic states
Inter for interface copy, JetBrains Mono for prices and chart data
4px base scale for padding, margins, and gaps
Compact controls, rounded surfaces, and soft elevation
Elevation
Reusable trading controls and data patterns
| Symbol | Net chg | Change | Last | Volume |
|---|---|---|---|---|
| AAPL | ▼ $3.07 | −1.35% | $223.71 | 17.2M |
| AMD | ▲ $2.38 | +1.49% | $162.16 | 23.0M |
| NVDA | ▲ $3.05 | +2.57% | $121.90 | 210.3M |
| TSLA | ▼ $9.53 | −3.83% | $239.49 | 54.4M |
The document became a shared set of constraints for the implementation. Instead of asking AI to reinterpret the visual language with every new component, I gave it an explicit system to work within.
Designing a familiar structure
Trading terminals use well-established interface patterns. Reinventing their basic architecture would have made the prototype less familiar to participants and introduced unnecessary noise into the research.
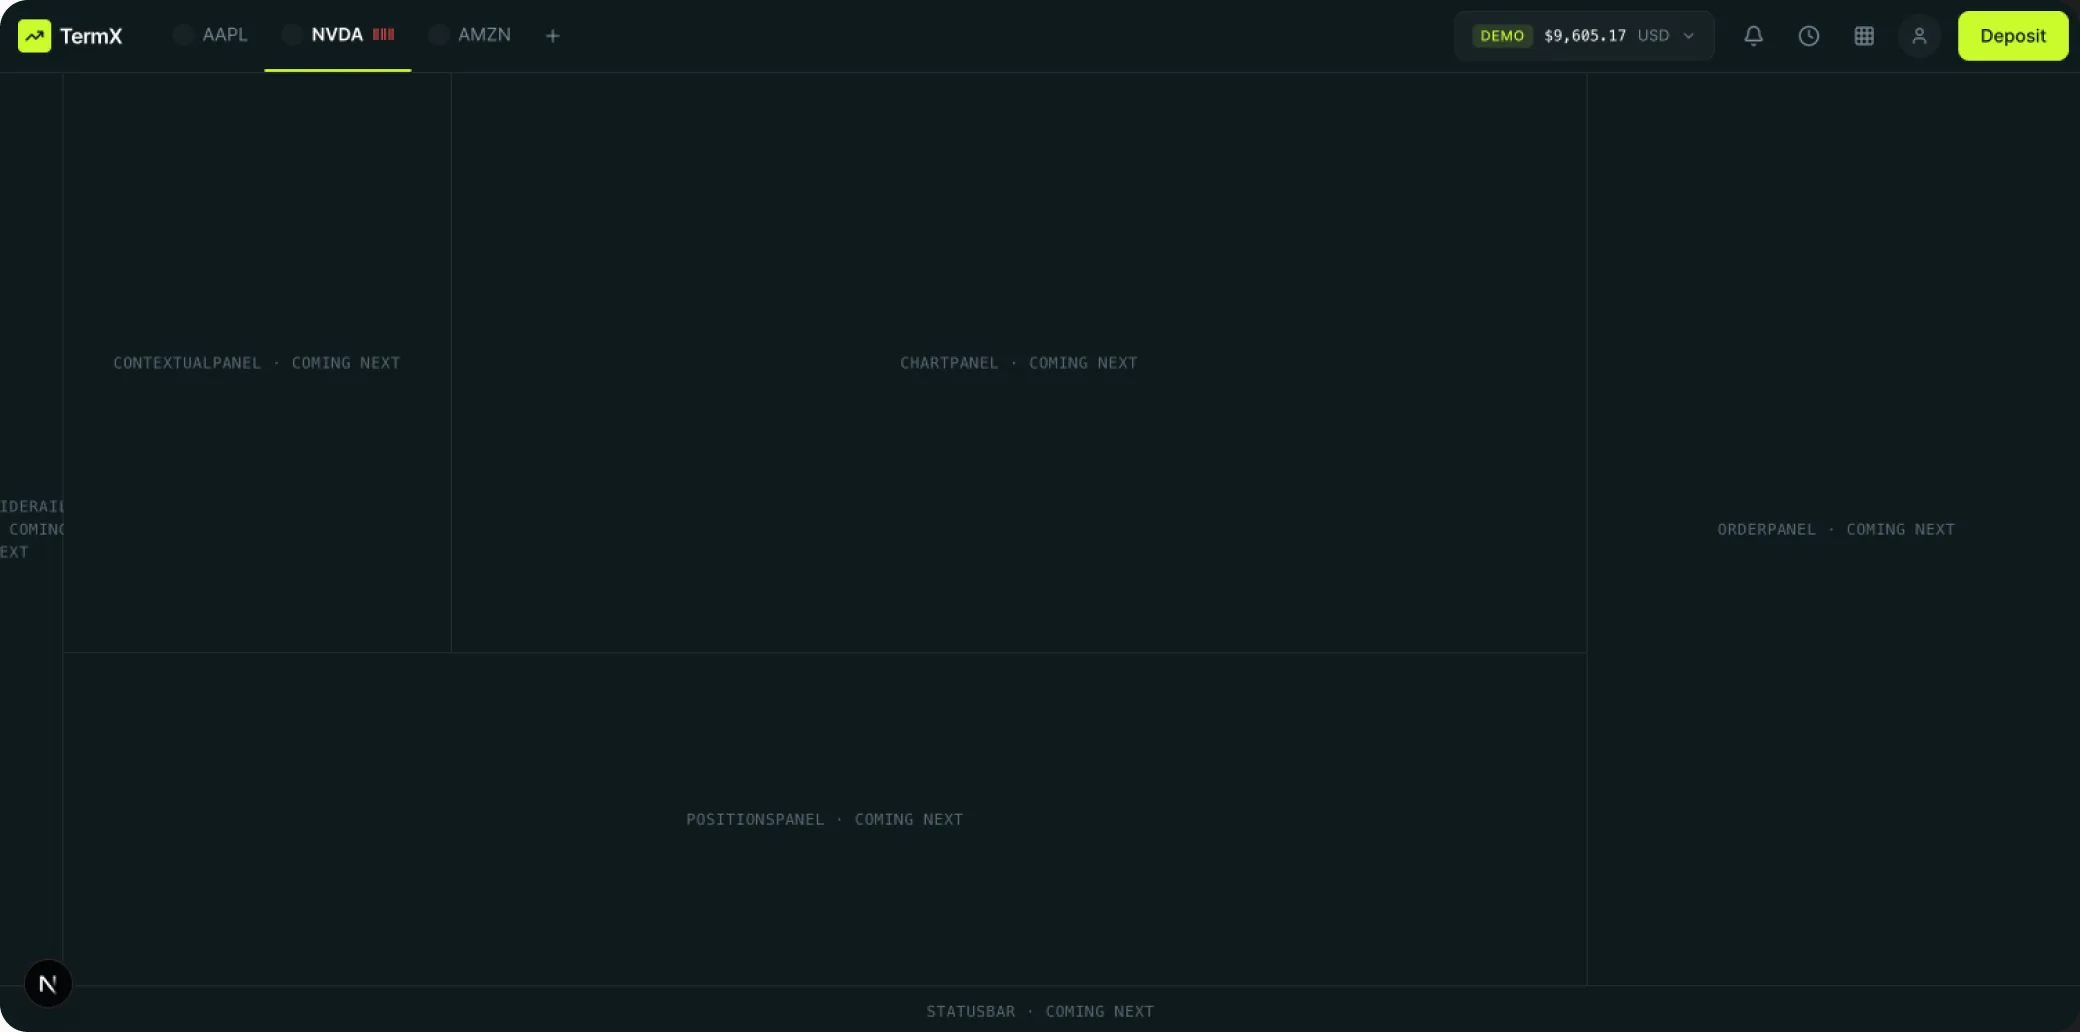
I organised the terminal as a single desktop workspace with connected areas:
- Navigation menu
- Instrument tabs
- Interactive chart
- Order entry
- Positions panel
- Account balance and status
I first mapped the structure in a quick wireframe, then moved into the functional implementation. The goal was not novelty. It was to give participants an environment they could understand immediately, so the study could focus on the flows being tested.
Building in controlled slices
I built the prototype incrementally, treating each part of the terminal as a stable vertical slice.
Each slice was developed in its own branch. Once it behaved correctly and matched the visual system, I merged it into the main version and moved to the next area.
This approach limited the impact of mistakes and preserved working checkpoints throughout the project. If an AI-assisted implementation went in the wrong direction, I could return to the last stable state without losing the rest of the prototype.
AI accelerated execution, but the repository structure, design rules, and incremental workflow kept that execution under control.
Making the prototype feel real
The prototype’s fidelity came from its behavior, not only its visual polish.
I integrated TradingView for the chart and added regularly updating market data so the interface did not feel frozen during a session.
More importantly, each action propagated through the system. Selecting an instrument changed the chart and order panel. Opening a trade created a position. The position affected account values and appeared back on the chart.
That causal relationship was what made the prototype useful for research.
Prototype capabilities walkthrough
Learnings
Behavioral fidelity matters more than screen fidelity
For a complex product, visual polish alone does not create a high-fidelity prototype. The fidelity that matters is causal: an action in one part of the product should change the rest of the system in a believable way.
AI works best inside explicit constraints
Claude Code provided speed, but it did not define the product. The prototype remained coherent because the domain, visual rules, architecture, and scope were made explicit before and during implementation.
A prototype can now be a working system
Designers no longer have to choose only between a fragile click-through and a costly engineering build. AI-assisted development creates a useful middle layer: realistic enough for research, without the infrastructure required for production.